The curtain just came down on the worst year in the stock market since 1931 -- the third worst decline in the history of the stock market. Only 1907 and 1931 endured greater declines.
What happened to Bob Brinker's market-timing? He did a fully invested five-year round-trip from S&P 807 (March, 2003) to an almost double at 1565 (October, 2007), then back down to 752 in November, 2008.
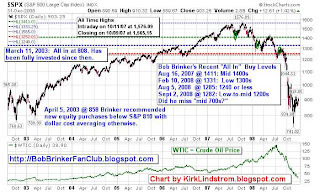
Unfortunately, by the time Brinker was aware that it WAS a bear market, it was too late for him to recommend selling. He never recommends selling into weakness, so he rode it out fully invested as the S&P 500 Index dropped below his famous March 11, 2003 buy-signal of S&P 807. A crystal ball would have told him that he could have waited and issued a lower buy signal on November 20, 2008 when the S&P closed at 752.
As 2008 began, Brinker was a raging bull -- predicting new highs into the 1600's, and calling S&P 500 Index mid-1400's a "gift-horse buying-opportunity" in the January issue of Marketimer.
But the market started to drop precipitously, so on
February 10th, Brinker issued a lower buy-signal in the low-1300's. He talked about this call on Moneytalk in May. He claimed that he had made the call based on the March lows (which in his opinion, were THE lows for the market).
Moneytalk, April 19, 2008, (S&P 1390.33) Bob Brinker said: "...........if you are looking for the market into 2009, then obviously, you should be feeling pretty good about your stock market portfolio. Because not only has it shown a very nice advance since the correction lows in March...............but in addition to that, I think it has a lot further to go. And I continue to expect, as I have said, that we will see new all-time-historic-record highs in the S&P 500 Index."
Moneytalk, May 10, 2008, Bob Brinker said: "I mentioned last week we had a recent guest on the program back when the market was at the lows – when the market was down around 1300 in the S&P……..he was bearish as a (unintelligible) bears. And I remember telling the audience, I said look, it’s a free and open exchange of ideas. This is not my view. I happened to be very bullish at that time.......In fact, at that time, I happened to have a buy signal on the market when the market was down around 1300. But he was coming with his bearish views………”
By
Then the market was hit with the worst month of June ever; and by July, all the indexes had dropped firmly into bear market territory. Brinker began blaming the declines on the rise in the price of oil -- calling oil a "wild card" and saying it had an "inverse correlation" to the stock market.
However, by the time October rolled around, that tactic was looking really silly because the price of oil had been dropping faster than the stock market. And indeed, seemed to be moving in tandem with it, so he never mentioned the theory again on Moneytalk or Marketimer.
After the market hit bear territory, Brinker issued the following buy levels and subsequently removed them:
* Sept 2, 2008 @ 1282: Low-to-mid 1200's
* September 16th -- rescinded low-to-mid 1200's (recommends dollar cost-average only)
Currently, Brinker continues to recommend dollar-cost-averaging, and he is waiting for “conditions” to “fall into place” in order for him to issue a new market-bottom and “attractive for purchase” level.
December 3, 2008, Marketimer, Bob Brinker said: “We continue to focus our efforts on the ongoing bottoming process that we regard as essential to establishing the level from which a sustainable market uptrend can occur. When we reach the point at which we can upgrade our current stock market view from dollar-cost-average to a renewed buy recommendation, we will do so."
* The Dow ended down 34%.
* The S&P 500 Index ended down 40% for the year.
* The Nasdaq ended down 40% for the year.
* Oil ended at $42.72.
Now the good news for all of us is that the stock market had the biggest final 2-days year-end rally EVER.
More good news is that the stock market has rallied considerably off of its November lows -- from 752 to 906.
That's quite an upward move for a professed market-timer like Bob Brinker to miss. Will it hold? We shall know in the fullness of time. 8^)
As they say, pictures are worth a thousand words. Please take a look at these charts by Kirk Lindstrom:


HAPPY NEW YEAR TO EVERYONE! (PS to Drafted, Quis and Hairie13, I haven't forgotten my promise to you.) 8-)
.

